Product-led growth sounds simple on paper. The product distributes itself. Users invite teammates, share links, embed workflows — and awareness spreads without a traditional sales push.
But exposure isn’t the same as adoption.
In PLG SaaS, signups aren’t the real win. Activation is. If users don’t experience value quickly, they churn just as quickly.
And the data reflects that. According to Userpilot’s 2025 SaaS product metrics benchmark report, the average activation rate across PLG products is 34.6%, with core feature adoption at 24.3%. In other words, most users never reach the product’s real value.
So what’s happening?
Users sign up. They explore. They click around. And then they leave — often before hitting the “aha” moment.
This is where a content funnel built specifically for PLG becomes critical.
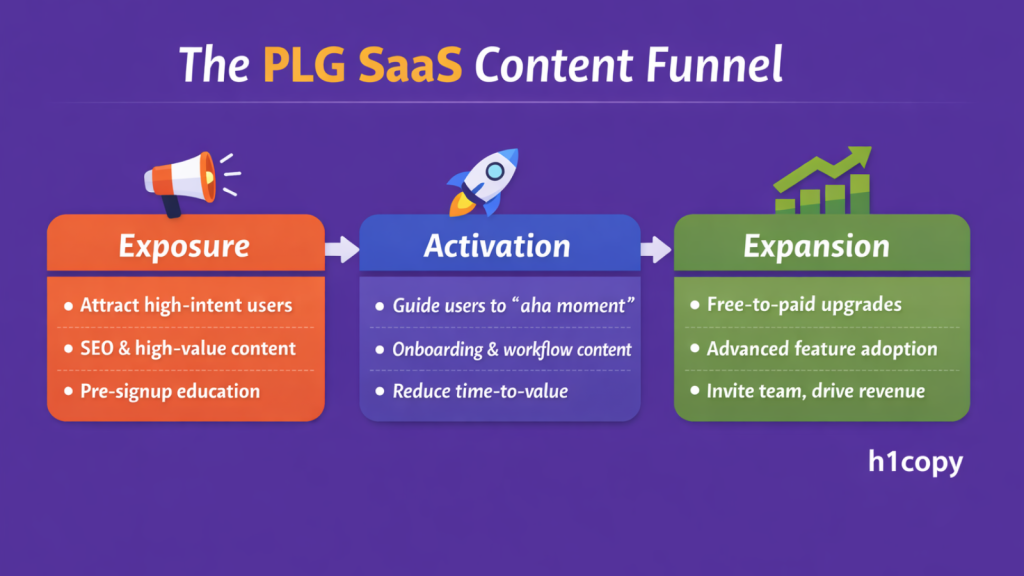
Content in a PLG model isn’t just for traffic. It prepares users before signup, guides them toward activation, and supports expansion after value is realized. It works alongside the product to accelerate adoption.
Let’s break down what that funnel actually looks like.
What a product-led growth funnel actually looks like
Before we talk about funnels, let’s clarify the model.
Product-led growth (PLG) is a strategy where the product drives acquisition, activation, retention, and expansion. The product isn’t just something you sell — it’s the main growth engine.
That’s different from sales-led growth.
In a sales-led model, revenue depends on human interaction. Marketing generates leads. Sales qualifies them, runs demos, handles objections, and closes the deal. The product only becomes central after the contract is signed.
Marketing-led growth shifts more responsibility to marketing. Content, ads, and campaigns generate marketing-qualified leads. Sales may still close the deal, but most of the work happens before the user meaningfully interacts with the product.
Here is what they look like side by side:
| Traditional growth funnel (SLG/MLG) | Product-led growth funnel |
| Traffic | Traffic |
| Leads | Sign-up |
| MQLs | Activation |
| Sales calls | Retention |
| Closed deals | Expansion revenue |
Both models start with traffic. After that, the paths diverge.
In traditional funnels, leads are nurtured and passed to sales. In PLG, users enter the product immediately. Growth depends less on how many leads you capture and more on how many users activate, stay, and expand.
That’s why SaaS growth metrics look different in a product-led model.
Key PLG metrics that define the funnel
Before structuring a content funnel for PLG SaaS, you need to understand the metrics that define success. In a product-led model, growth isn’t measured by lead volume or closed deals alone. It’s measured by how users behave inside the product.
Here are the core metrics that shape the PLG funnel.
Activation
This is the percentage of new sign-ups who reach a pre-defined value moment inside the product. This could be creating a first project, inviting a teammate, or completing a core workflow. Activation tells you whether users are actually experiencing value, not just creating accounts.
Time-to-value
It is the amount of time it takes a new user to reach the activation milestone. In PLG SaaS, shorter time-to-value increases the likelihood of retention. The longer users wander before seeing results, the higher the drop-off.
Retention rate
The percentage of activated users who continue using the product over a defined period. In product-led growth, retention signals real adoption. Without it, activation becomes a vanity metric.
Product-qualified leads (PQLs)
These are users who demonstrate meaningful in-product behavior that indicates buying intent. This could include repeated feature usage, collaborative activity, or hitting upgrade thresholds.
In PLG SaaS, PQLs replace traditional MQLs because qualification is based on product behavior.
Together, these PLG SaaS growth metrics define the product-led growth funnel.
But metrics alone don’t drive growth. Content does.
Now that the definitions are clear, let’s shift from theory to execution and break down how to structure a content funnel that supports exposure, activation, and expansion in PLG SaaS.
Stage 1: Exposure (attracting high-intent users)
PLG products can distribute themselves, but exposure alone won’t guarantee adoption. Content shapes perception, qualifies users, and sets the stage for activation. The goal at this stage is simply to drive qualified traffic that is likely to activate.
High-intent SEO content for PLG SaaS
Creating content that attracts users who are already primed to see value is key. Focus on bottom-of-funnel and high-intent topics that naturally match your product’s core value.
The best way to find high-intent keywords for your context is to conduct keyword research using tools like Ubersuggest, Ahrefs, or Semrush. Each tool has its strengths:
- Ubersuggest: good for small or early-stage brands; simple interface, affordable.
- Ahrefs: great for competitive research and backlink analysis; ideal for scaling PLG SaaS.
- Semrush: strong for content planning and keyword trends; works well for SaaS teams with larger budgets.
Examples of BOFU content formats to match your keywords
- Comparison pages (help users evaluate alternatives)
- Use-case pages (show the product solving real problems)
- Category education (teach users why the category matters)
- Integration pages (highlight complementary tools and workflows)
Metric connection
At the exposure stage, traffic alone is a vanity metric. What matters is what happens after signup.
If your high-intent SEO strategy is working, your signup-to-activation rate should improve. Users arriving from comparison pages, use-case content, or integration guides aren’t casually browsing — they’re evaluating.
When expectations are clear before signup, users enter the product with intent, reach value faster, and activate more often. If traffic increases but activation doesn’t, the issue isn’t volume — it’s misalignment.
Structuring content for AI-driven discovery
AI-powered search is changing how users discover products. Content is no longer competing only in traditional search results — it’s being surfaced inside AI summaries, conversational answers, and recommendation systems.
If you want your content to reach users who are most likely to activate, it needs to be structured in a way that AI systems can interpret, extract, and trust — not just rank.
Also read: Saas Marketers Share What Not To Use AI For
How to do it
- Use clear definitions and concise explanations for key concepts.
- Organize headings and subheadings as questions or search-intent queries.
- Implement clean internal linking between related pages and product features.
- Use short, readable anchor text for links.
- Add structured data/schema where relevant to help AI indexing.
- Break content into scannable blocks, lists, tables, and visuals to keep readers engaged.
Metric connection
Well-structured content means a higher AI/semantic discoverability, which would lead to qualified traffic and improved signup-to-activation rate.
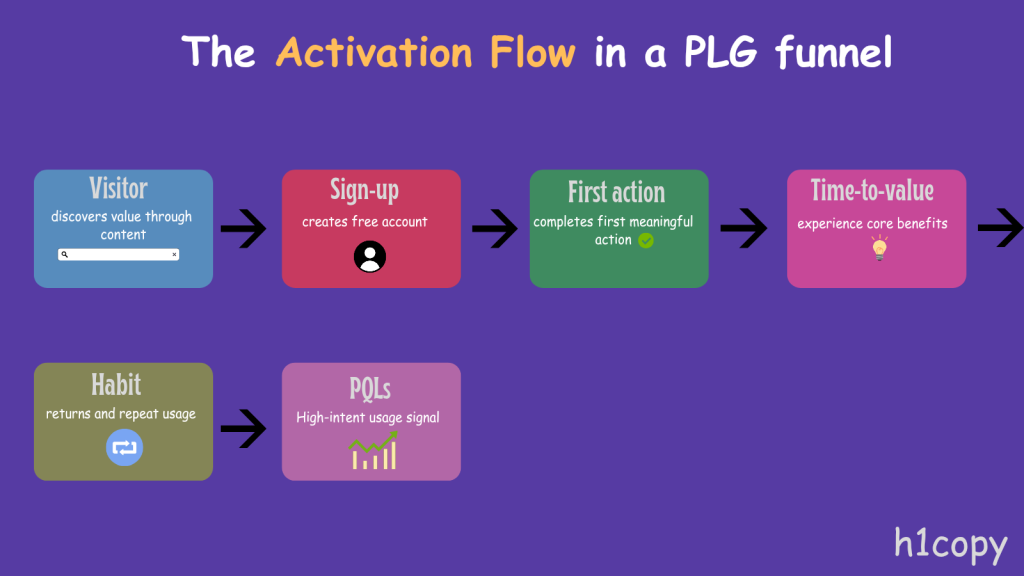
Stage 2: Activation (reducing time-to-value)
In PLG SaaS, activation is the real conversion. Activation is the first meaningful action a user takes that delivers real value.
While time-to-value measures how long it takes to reach that moment. Which is often regarded as the “aha” moment by many Marketers.
The faster a user experiences value, the more likely they are to stick around and adopt your product long-term.
| Stage | Content focus | Examples | Metrics to track |
|---|---|---|---|
| Pre-signup | Educate and qualify high-intent prospects | 1. Workflow walkthroughs 2. Template libraries 3. Demo videos 4. Interactive examples | 1. Activation rate 2. Time-to-value 3. Better sign-up quality |
| Post-signup | Guide users to first value and feature adoption | 1. Onboarding emails 2. Tutorials 3. Product documentationI 4. In-product microcopy | 1. Higher activation rate 2. Faster time-to-value 3. Increased feature adoption 4. Lower onboarding abandonment |
Pre-signup tips
- Highlight core workflows clearly in walkthrough blog posts, so users understand the value before signing up.
- Provide hands-on experience with templates or interactive demos to give users a taste of what the product can do.
- Use demo videos to visually show the product in action.
- Ensure CTAs are clear to guide users toward signup.
Post-signup tips
- Design onboarding emails to guide users through core features one step at a time.
- Create tutorials and support content that guide users, step-by-step, toward activation.
- Include in-product microcopy and tooltips to help users take meaningful actions immediately.
- Track engagement with each piece of content to identify where users might drop off.
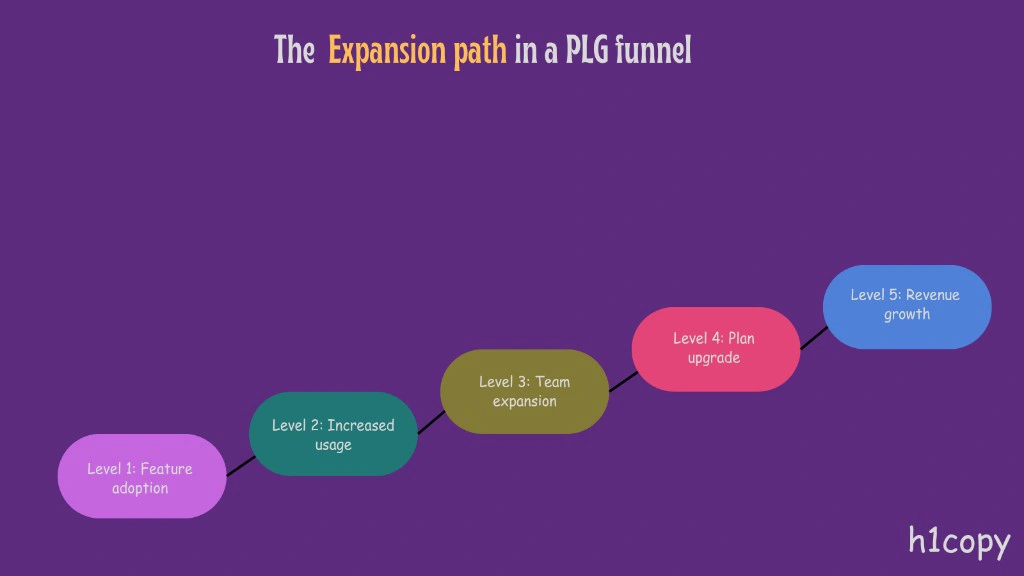
Stage 3: Expansion (from adoption to revenue growth)
Adoption without expansion limits PLG revenue. Expansion happens when existing users increase product usage, invite team members, or upgrade to higher tiers. Content plays a supporting role here. It can show users what is possible and guide them toward new features or paid plans.
The table below breaks down the types of content that support both free-to-paid conversion and advanced feature adoption, along with the metrics you can track to measure their impact. This way, you can see how content and product work together to drive sustainable PLG growth.
| Stage goal | Content focus | Examples | Metric connection |
| Free to paid conversion | Highlight premium benefits | 1. Upgrade comparison pages 2. ROI calculators 3. Gated tutorials 4. Case studies | 1. Free-to-paid conversion rate 2. Expansion revenue |
| Feature adoption/Expansion | Educate on advanced features | 1. Advanced feature guides 2. Workflow deep dives 3. Industry-specific use cases 4. Feature release guides | 1. Feature adoption rate 2. PQL growth 3. Team invites |
Content supports growth — it doesn’t replace product value
Content can guide users to explore features and understand the value of upgrading, but it can’t create value if the product doesn’t deliver. Whether encouraging free-to-paid conversion or adoption of advanced features, the product itself must offer meaningful benefits. Content simply highlights what is possible and helps users realize the value.
Also, it is important to know that growth that isn’t measured is guesswork. If exposure drives traffic, activation drives adoption, and expansion drives revenue, it’s only natural to track your results and measure whether your PLG content funnel is actually working.
How to measure the success of a PLG SaaS content funnel
We have already defined activation, time-to-value, and all the other metrics several times above
So let’s skip straight to the good stuff: how to measure them, make sense of the data, and take action that actually moves the needle.
The exact metrics to track at each stage
| Stage | What to measure | Tools | What it tells you |
| Exposure | 1. Organic traffic from high-intent keywords 2. Blog-to-signup conversion rate 3. Signups per content page 4. Assisted conversions from content | 1. Google Analytics 2. Ahrefs 3. SEMrush | Whether your content is attracting the right users, not just traffic, but potential activators |
| Activation | 1. % of new users completing the activation event 2. Average time-to-value (hours/days) 3. Onboarding drop-off rate 4. Content-assisted activation (users who viewed help content before activating) | 1. Mixpanel 2. Amplitude 3. Heap | Whether users are reaching their activation stage. The “aha” moment, and how fast |
| Expansion | 1. Advanced feature adoption rate 2. Free-to-paid conversion rate 3. Expansion MRR 4. Revenue per account over time 5. Feature usage before upgrade | 1. ProfitWell 2. ChartMogul 3. Mixpanel | Whether adoption is turning into revenue and deeper product usage |
Make your metrics actionable
Metrics only matter if they influence decisions. Tracking exposure, activation, and expansion is useful — but only if the data helps you identify friction, adjust strategy, and improve outcomes.
Here’s how to turn PLG metrics into actionable insights.
1. Centralize everything
Pull product usage, content engagement, and revenue data into one dashboard (Looker Studio, Tableau, Measure Studio). When data is fragmented, insights are fragmented. A unified view helps you see how exposure affects activation and how activation impacts expansion.
2. Connect the dots
Don’t analyze metrics in isolation. Low expansion is often the result of weak activation. Weak activation may stem from misaligned exposure.
For example, if traffic is high but activation is low, your content may be ranking well but failing to set the right expectations or drive meaningful next steps. That’s an alignment issue — not a traffic issue.
3. Act fast
Once you identify a friction point, test a fix. Improve onboarding emails. Add clearer CTAs. Publish feature tutorials. Refine workflow guides.
PLG growth rewards iteration.
Measure → Learn → Iterate. Every insight should lead to action across both content and product.
4. Recommended tools
To support this process, use tools that connect content performance with product and revenue data:
- Mixpanel — track activation events, onboarding funnels, and feature adoption
- ChartMogul — monitor free-to-paid conversion and expansion MRR
- Amplitude — analyze user journeys and retention
- Looker Studio — visualize data from multiple sources in one dashboard
With the right tools and a clear framework, content stops being just content — and becomes measurable growth tied directly to every stage of the funnel.
Frequently asked questions (FAQs)
What is a PLG content strategy for SaaS?
A PLG content strategy uses targeted content to drive exposure, activation, and expansion in product-led growth SaaS. It attracts high-intent users with BOFU topics like use cases and comparisons (Stage 1), guides quick value realization via tutorials and onboarding emails (Stage 2), and promotes upgrades with feature guides (Stage 3). Unlike sales-led funnels, it ties directly to metrics like activation rate (34.6% average per Userpilot 2025) for measurable adoption.
How does content improve SaaS activation rates?
Content boosts SaaS activation rates by priming users pre-signup (e.g., workflow demos, templates) and guiding post-signup (e.g., in-product tooltips, tutorials). This reduces time-to-value and lifts the average PLG activation benchmark. Track via Mixpanel: content-assisted activations show where high-intent traffic from Stage 1 converts to real “aha” moments in Stage 2.
What are the best PLG SaaS growth metrics to track?
Key PLG SaaS growth metrics include activation rate (users hitting value milestones), time-to-value (speed to “aha”), retention rate, and product-qualified leads (PQLs from in-product behavior). Unlike MQLs, PQLs signal upgrade intent. Use Amplitude or Heap to connect them across your content funnel stages for insights on traffic quality and expansion revenue.
How to create high-intent SEO content for PLG products?
Target BOFU keywords with tools like Ahrefs or Semrush for comparison pages, use-case guides, and integration content (Stage 1). Structure for AI discovery: question headings, schema markup, scannable lists/tables, and clear CTAs to signups. This drives qualified traffic that improves signup-to-activation rates over generic top-funnel posts.
What tools measure PLG content funnel success?
Track PLG content funnels with Google Analytics (exposure traffic), Mixpanel/Amplitude (activation/time-to-value), and ChartMogul (expansion MRR). Centralize in Looker Studio to spot friction — like high traffic but low activation — and iterate. These tie content performance to product metrics for actionable growth.
How to reduce time-to-value in PLG SaaS?
Cut time-to-value in PLG SaaS with pre-signup walkthroughs/demos and post-signup onboarding emails/microcopy (Stage 2). Offer templates for instant workflows and track drop-offs via Heap. Shorter TTV boosts activation and retention, turning signups into sticky adoption faster than sales-led models.
What is the difference between PLG and sales-led growth funnels?
PLG funnels go Traffic → Signup → Activation → Retention → Expansion, with the product as the growth engine. Sales-led (SLG) uses Traffic → Leads → MQLs → Sales Calls → Closed Deals. PLG prioritizes in-product metrics like PQLs over leads, making content essential for self-serve activation (24.3% core feature adoption average).
How does content drive PQLs in product-led growth?
Content generates product-qualified leads (PQLs) by attracting users who activate and engage deeply (e.g., advanced features in Stage 3). Use ROI calculators, case studies, and upgrade pages to nurture them toward free-to-paid conversions. PQLs outperform MQLs in PLG as they’re behavior-proven, boosting expansion MRR.
Why is content important for SaaS expansion revenue?
Content fuels SaaS expansion by educating on premium features via deep-dive guides and industry use cases (Stage 3), turning activated users into payers. It highlights free-to-paid gaps without hard sells, tracking via feature adoption rates and ProfitWell. True expansion requires product value, but content accelerates team invites and upgrades.