
100 likes on X, 1K upvotes on Reddit, and 50 impressions on LinkedIn are no proof of real demand.
You’re posting consistently, trying different content formats. Even spent $200 running ads. Yet, no product signup.
Every social media platform trains you to chase those vanity metrics — likes, impressions, reposts— because they are visible. They tell you people saw your post, not that they need your product.
The real question isn’t whether people will engage with your post or content. Are they willing to buy?
In early-stage SaaS, where you have limited time to spend on false signals, metrics that reveal buying intent and real behaviour are your compass.
This piece aims to break down the difference between vanity metrics and metrics that signal demand, and reveal which metrics predict demand — and which don’t. How to track these signals and the type of posts that spark product demand.
Let’s dive in.
Vanity metrics vs demand metrics
After analyzing 10,000+ startups, 73% of early-stage founders admit they celebrate vanity metrics while ignoring warning signs.
They operate under the illusion that liking, sharing, and commenting mean the product must be gaining momentum. Leading to more reach, then awareness. And eventually, more revenue.
On the surface, it sounds logical. Except, it doesn’t work that way.
Moshin Ishtiaq, three months after launching MetricFlow, became obsessed with the surge of a thousand new visitors from a single Reddit post, and the growth in his follower count on X, only to get hit with 25% churn rate and a flat Stripe account.
The problem wasn’t traffic. It’s what happened after people signed up.
Once he focused on the customer support inbox, the marketing vision pivoted from top-of-funnel acquisition to bottom-of-funnel activation and retention, cutting churn rate by 2%.
Another SaaS founder who became fixated on tracking success by website visitors and social media followers got stuck at $2,000 MRR with 10,000 monthly visitors. After cutting traffic and focusing on revenue drivers, MRR tripled to $12,000 with 1,500 monthly visitors.
The lesson is clear. Engagement measures interest, not intent.
You can have a thousand impressions, a hundred likes, and shares that spread your content to audiences who aren’t your customers. Yet, no one converts.
That’s the gap between vanity metrics and metrics that signal demand.
Also read: Best B2B SaaS Content Writing Agencies in India
Vanity metrics
Vanity metrics are surface-level numbers that look impressive but don’t give you insight into actual buying intent.
Follower count, likes, and impressions. They give you a sense of validation but aren’t tied to meaningful outcomes.
For early-stage startups, hitting 10,000 visitors may feel like progress. Crossing 5,000 email subscribers will feel like momentum. But if no conversion happens, all shiny numbers become noise.
Demand metrics
Demand metrics (also called revenue metrics or traction metrics) are directly related to money coming into your business. If these numbers go up, your business is growing. If they go down, your business is in trouble.
Although they’re harder to track and scale, they prove to be the only numbers that correlate with actual customer behaviour — clicks, demo requests and email sign-ups.
Also read: Top 5 Content Marketing Mistakes B2B Founders Make
Social media metrics that do not signal demand
Here’s a breakdown of metrics that do not signal product demand.
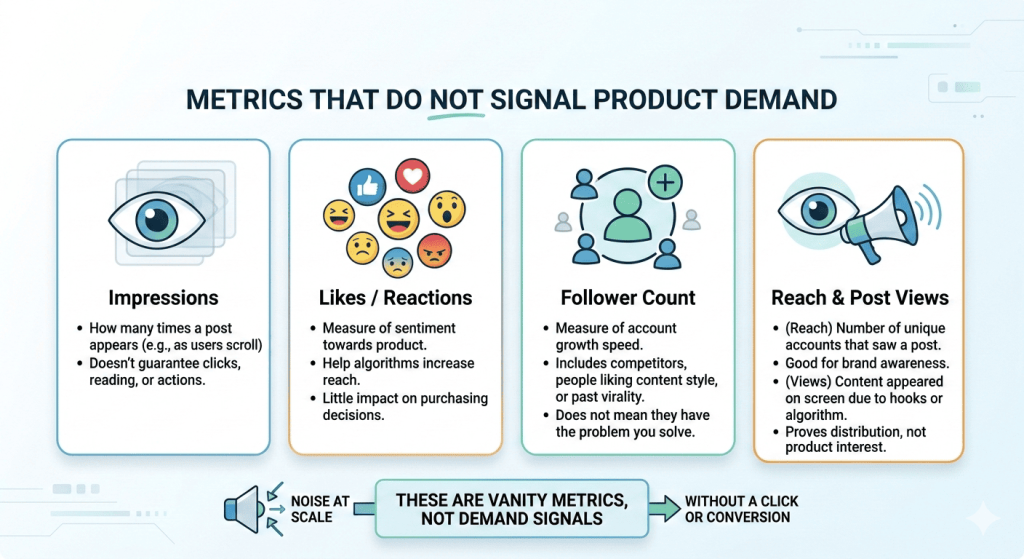
Impressions
Impressions indicate how many times your post appears in a user’s feed as they scroll.
For instance, one person seeing your post 10 times on X(Twitter) counts as 10 impressions. So think, how many posts you blow past in sixty seconds without registering a single word? Exactly.
It doesn’t tell you if someone clicked, signed up, asked a question, or even read your post.
Likes/ reactions
The likes, love, haha, wow, sad, and angry reactions measure sentiments towards your post.
A high number of likes or reactions indicates your post successfully captured your audience’s attention, which in turn signals the algorithm to increase your content’s reach.
Despite that, likes and reactions have little impact on whether people are interested in purchasing your product.
Someone may love your post because they agree with the insight, find the story relatable, or simply appreciate the way it was written, but it isn’t a yardstick for product demand.
Just like Moshin—treating likes and reactions as validation from a single Reddit post—your post becomes optimised for emotional resonance rather than demand generation.
Follower count
Follower count is a measure of how fast your social page is growing. It tells the total number of accounts that find your post interesting and choose to follow your profile.
In many cases, people follow the content creator, rather than the product itself. They enjoy the insights, storytelling, or commentary, but still do not need the tool being promoted.
This is why founders who garner a lot of followers sometimes struggle to convert even a small percentage of that audience into paying users.
And there’s data to prove that. Accounts with fewer than 1,000 followers can see engagement rates of 5–8%, while accounts with more than 1 million followers often drop to 0.4–0.8%.
In other words, follower count alone says little about your audience having the problem your product solves — or whether they will ever become paying customers.
Reach
Reach refers to the number of unique accounts that saw your post. It seems similar to impressions, but it isn’t.
Think of it this way. If someone sees a post eight times, that’s eight impressions. But that person would only count as one person reached.
If brand awareness is your goal, reach is the go-to metric. But without a click, comment, or visit to your site, it’s just noise at scale.
Post views
Post views indicate how many times your content has appeared on someone’s screen.
Someone might view your post because of a strong hook. Or because the platform’s algorithm decided to surface it.
But on their own, they prove distribution, not product interest.
Social media metrics that signal demand
Here are metrics that signal product demand.
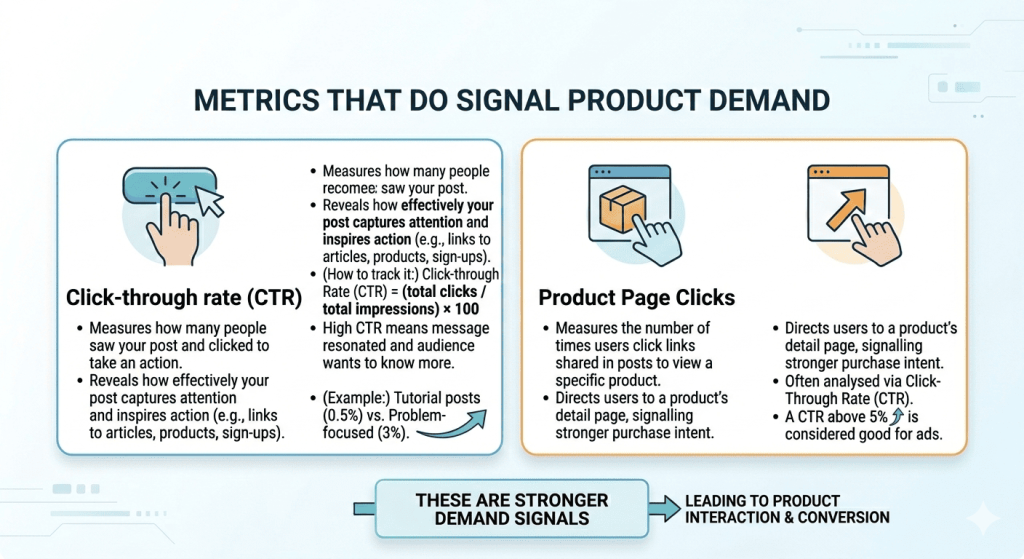
Click-through rate (CTR)
CTR is the first honest metric you’ll encounter in the group. It measures how many people saw your post and clicked to take an action.
If you add a link to your latest article, product, or sign-up page, CTR reveals how effectively your post captures the audience’s attention and inspires them to act.
Now, getting a good CTR rate requires work. To optimise your social media post for a high CTR, here are a few things to note:
- Define your audience — those you created your product for.
- Be sure to tailor your message to fit your audience; otherwise, they’ll scroll past it, leading to impressions.
- Use captivating headlines or hooks that speak directly to your audience’s pain points.
- Enhance your content with visuals that effectively convey your message, making it difficult to scroll past.
- Include a clear call-to-action, telling readers exactly what to do next, whether it’s “Sign up for a free trial” or “Learn how to solve this problem.”
- Target your audience where they are, test variations, and analyse results to refine future posts for maximum clicks.
If tutorial posts get 0.5% and problem-focused posts get 3%, that tells you exactly what your audience actually responds to versus what they passively enjoy.
Mind you, CTR benchmarks differ widely by content type, platform algorithm, and post placement, to name a few. CTRs above 5% are generally considered quite good for social media ads, whereas those below 1% are often regarded as low.
How to track it:
Click-through Rate (CTR) = (total clicks/total impressions) ✕ × 100
Product page clicks
Product page clicks measure the number of times users click links shared in your posts to view a specific product.
Unlike general clicks that direct users to a blog or landing page, product page clicks lead an individual to a product’s detail page, signalling stronger purchase intent.
This metric is often analysed via Click-Through Rate (CTR), which indicates how effectively your post converts impressions into potential customers. A CTR above 5% is considered good for ads.
How to track it:
You can set up UTM parameters for every platform you post on so you’ll see exactly where your product page traffic is coming from.
Demo requests from social
As the name implies, it refers to the number of product demo requests that originate directly from social media interactions.
If someone books a demo on LinkedIn, Reddit, or X(Twitter), you have validated demand in that channel.
For instance, Joel Gascoigne, founder of Buffer, built a two-page MVP to explain his idea. He shared it on his Twitter (now X) page, gained useful feedback from his existing audience, and considered it his first validated learning. Leading to paying customers in 7 weeks.
He used social media to test demand. The interest was measured by signups and willingness to pay, not in likes.
How to track it:
Add UTM parameters to every social link, set up a “demo submitted” conversion event in Google Analytics (GA4), and use its attribution reporting to connect specific posts and campaigns to completed demo requests.
Comments that express intent
Intent-based comments are one of the highest-value metrics you can track, because they’re self-qualifying leads who’ve made themselves visible.
Instead of giving passive likes or saying “Great post!”, they comment with questions such as “Does this integrate with HubSpot?” or “What’s the pricing for teams of 50+ people?”
This comment alone is worth more than 150 LinkedIn impressions.
Asked repeatedly, comments like this become an early indicator of product-market fit.
How to track it:
- Define what counts as intent (pricing, integrations, trials, or use-case questions).
- Manually review and log those comments from platforms like LinkedIn or X.
- Then check if those people later book a demo or sign up to see if intent turns into demand.
Paid ad conversions
Paid ad conversions measure valuable actions users take after clicking your social media ad. That action could be: booking a demo, signing up for an email list, or purchasing a subscription.
These actions are clean demand signals. A user saw your message, had a problem, and decided to give your product a shot.
This proves that:
- Your messaging works
- You’re targeting the right audience.
- Your product is market-fit.
How to track it:
Set up tracking pixels and UTM parameters, then measure the ad clicks conversion rate.
This helps keep your ads in check to see if they are generating real business results, not just traffic.
Direct messages (DMs)
DMs are the strongest signal of product demand.
When someone slides into your DM to ask about pricing or share a specific use case, they’re having a private conversation because they’re seriously considering your product.
In fact, 71% of adults are more likely to purchase from a company they can contact via messaging.
Revealing they’ve moved past casual interest into active evaluation.
How to track it:
Monitor message volume and tag conversations on LinkedIn, Reddit, and other social media platforms, and then record how many turn into demos, trials, or sales in your CRM.
How to track social media metrics effectively
Now you know which social media metrics matter to you and what to pay attention to, the next step is to track effectively.
Most social media platforms have built-in analytics that give you surface-level insight into tracking metrics. However, third-party analytics tools reveal deeper insights and a complete view of what’s working and what’s not.
Platform native insights
When it comes to understanding how your post performs, X, LinkedIn, Reddit, and all other social media dashboards give you insights into these demand-signalling metrics without leaving the app.
LinkedIn analytics
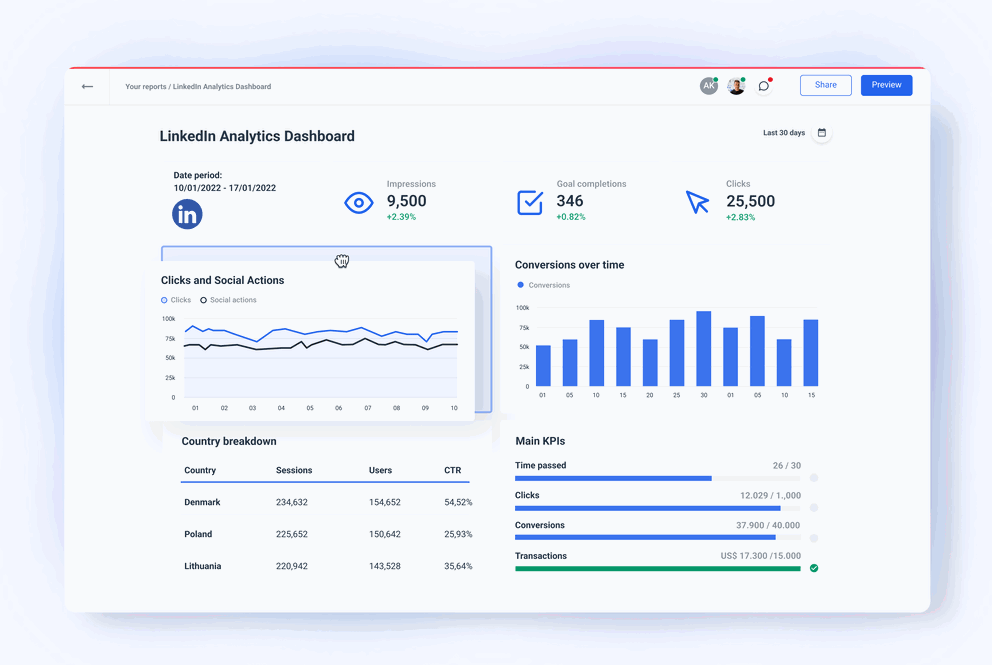
Demand-signalling metrics: Link clicks, comments (use-case related), DMs, demo form conversions.
How to track it: Using UTM parameters, you can track every click linked to your landing page to see which post or campaign led a user to visit. For DMs and comments, those occur within LinkedIn. Plus, by installing the LinkedIn Insights Tag on your website, you can see which LinkedIn post or ad made someone sign up or request a demo.
X (Twitter) analytics
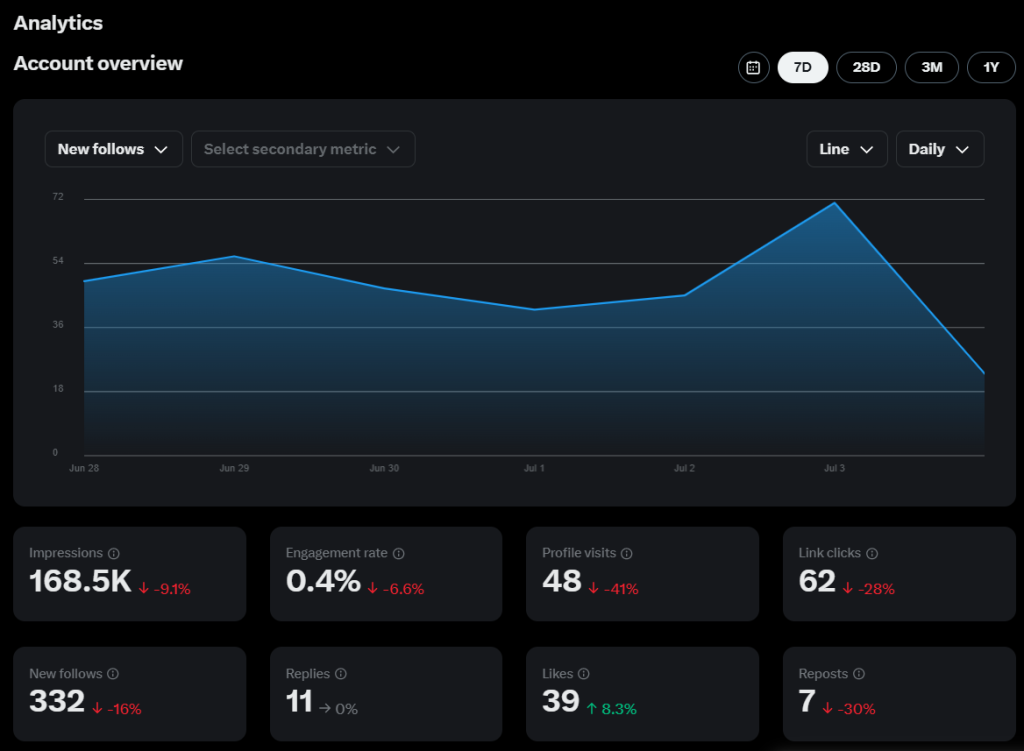
Demand-signalling metrics: Link clicks, replies, profile visits, DMs
How to track it: Link clicks, replies, and profile visits are tracked within its analytical dashboard; DMs are tracked in your inbox. But to determine which specific campaign or audience segment drove the click and conversion rate from click to signup, reporting is limited unless you’re using additional tracking tools.
Reddit insights
Demand-signalling metrics: Comments describing pain points, Clicks to site, Conversions.
How to track it: By installing Reddit Pixel or using UTM tracking to connect Reddit traffic to completed actions.
Social media analytical tools
Here are some third-party analytical tools that provide deeper insight into tracking these demand metrics.
Buffer
Buffer is a flexible social media toolkit that stands out for its scheduling activity. Rather than posting separately on X, LinkedIn, Reddit, and other social media platforms, it brings everything in one place.
You can write out a week’s post in one sitting, click “schedule”, and watch your post go live at the scheduled time.
When it comes to analytics, Buffer gives you insight into your followers’ growth, total impressions, total engagement, and audience.
In fact, Beccy Gibson, Founder of Tempt, says, “The analytics in Buffer allows us to track client performance, analyse our posts, and report our results. The efficiency of analytics reporting means that we can take learnings and adapt our future content to reflect those learnings.”
Hence, Buffer relieves you of the guesswork and gets it out of the way.
GA4 (Google Analytics 4)
GA4 is one of the best free analytics tools that gives businesses a holistic view of their customer journey from the first touch to final conversion.
Instead of relying on outdated session tracking like pageviews or last-click attribution, it captures every click as an event, providing granular data on human behaviour.
Adding UTM parameters to the links you share on X, LinkedIn, and Reddit tells GA4 exactly where the traffic originated, giving you detailed reporting on campaign performance.
For each social platform, GA4 tracks:
- Pageview
- Session start
- Engaged sessions
- Outbound click
- Pages/screens per session
- Average engagement time
- File downloads
- Conversions (if figured)
With these, you’ll be able to get the most out of your social media campaigns and effectively strategise for the future.
HubSpot
HubSpot acts as both a CRM and an analytics tool. All metrics from X, LinkedIn, Reddit and other platforms are brought into one dashboard.
Integrating directly with its CRM and marketing hub, HubSpot tracks how social posts drive traffic, leads, and sales.
It also views and compares performance across social media platforms, campaigns, and publishing times — all from a single tool.
What kind of post sparks engagement and signals demand?
For your post to attract thoughtful replies, DMs, and demo requests, you’ll agree that it must first be engaging and read-worthy before conversions can come in. Here are some post ideas that work fine.
Authentic founder stories
Sharing posts that reveal struggles, lessons learnt, or BTS moments is what led a SaaS founder from zero to 100 comments and 500 signups within 48 hours.
When founders share their stories, the audience values the journey behind the product instead of just a tool being marketed. This builds trust and encourages people to eventually try the product.
Thought leadership post
Posting consistently about insights, learnings, and product-related content provides real value to your audience and helps get your post noticed in niche communities. Keeping you top-of-mind.
Because when people repeatedly engage with useful insights from the same person, they begin to associate that individual with expertise in the problem space the product addresses.
Austin Hughes, founder of Unify, is a perfect example.
Austin used his LinkedIn page to talk about GTM strategy and lessons from building SaaS. When Unify announced its fundraising, the post generated 500+ inbound demo requests, and 90%+ of its inbound leads from organic social content.
Actionable lessons & founder POV
Posts that share practical advice give readers actionable takeaways, thereby drawing their attention.
Posting these ideas consistently can bring in your first 10 signups. On the flip side, it becomes overwhelming for you, as a founder, juggling sales, customer acquisition, and positioning.
At this point, h1copy is your safety net.
With its ghostwriting service for both LinkedIn and X(Twitter) social platforms, you are sure to build a scalable content engine that grows your brand, drives traffic, and turns content into revenue.
Book a call now and turn your posts into product sign-ups.
Frequently asked questions (FAQs)
What are vanity metrics on social media for early-stage SaaS?
Vanity metrics are surface-level numbers like follower count, likes, impressions, reach, and post views that don’t reveal buying intent or tie to conversions such as product signups or demos.
Which social media metrics actually signal demand for my SaaS product?
Click-through rate (CTR), product page clicks, demo requests from social, intent-based comments, paid ad conversions, and direct messages (DMs). These metrics show a user carried out an action like clicking links, asking about pricing, or booking demos, indicating real interest and buying intent.
Why are intent-based comments more valuable than likes for early-stage SaaS?
An intent-based comment indicates that users are interested in buying your SaaS product. For example, a user asking, “Does your product solve this?” Unlike likes that indicate emotional resonance with your brand.
How can direct messages (DMs) validate demand on social media?
For a user to slide into your DM to ask questions or make an inquiry about your product signals that the user has moved from casual interest to the evaluation stage.
Are likes and follower growth good indicators of SaaS product demand?
No. Likes measure sentiment but not purchase intent, and followers may include competitors or non-customers.
Why don’t post views or reach predict SaaS conversions?
Post views show content appearing on screens due to the algorithms. Users can scroll past without acting. Reach counts unique viewers who saw your post. But without clicks or comments, it’s nothing.
What is a good CTR for early-stage SaaS social posts?
A good CTR for SaaS social posts is 1-3%+ (e.g., 1.25% median organic per Databox benchmarks), signaling strong demand over vanity metrics like impressions. Track via (Clicks/Impressions) x 100; >5% on product links indicates audience resonance and predicts conversions like signups.
How do I track demo requests from social media for SaaS?
Use UTM parameters on links and GA4 events for “demo submitted” conversions to attribute requests from X/LinkedIn/Reddit. Tag intent comments/DMs in CRM; Buffer/HubSpot dashboards consolidate data, revealing which posts drive qualified leads beyond likes.
What are the best tools for SaaS social demand analytics?
Buffer for scheduling/CTR tracking, GA4 for UTM attribution across platforms, and HubSpot for CRM-integrated conversions (e.g., demo signups from posts). These outperform native insights by connecting social actions to revenue signals like product page clicks.
How do founder stories spark SaaS demand on social?
Authentic founder stories (struggles/BTS) generate intent comments/DMs over generic posts, as seen in Buffer’s Joel Gascoigne case (signups from X feedback). Focus here for early validation; test vs. thought leadership for highest CTR/demo rates.